Contents
Overview
The concept of measuring price variation in financial markets has roots stretching back to the earliest days of organized trading. While formal statistical measures like standard deviation gained traction in the 20th century, the underlying idea of 'risk' as price fluctuation was implicitly understood by merchants and financiers for centuries. Early financial theorists like Louis Bachelier laid foundational mathematical groundwork for understanding random price movements, though he didn't explicitly coin 'volatility' in its modern financial sense. The formalization of volatility as a key metric, particularly in options pricing, owes much to the work of Fischer Black and Myron Scholes, who developed the Black-Scholes option pricing model. This marked a pivotal shift from viewing price swings as mere noise to understanding them as quantifiable, predictable (to an extent) components of market behavior.
⚙️ How It Works
Market volatility is mathematically defined as the standard deviation of the returns of an asset or market index over a specified period. For instance, the S&P 500 index's daily returns might be analyzed to calculate its standard deviation, yielding a measure of its daily volatility. This calculation typically uses logarithmic returns for mathematical convenience and better statistical properties. Historic volatility (HV) is calculated directly from past price data, offering a backward-looking view. Implied volatility (IV), conversely, is not directly calculated but derived from the market price of options contracts. A higher option premium, all else being equal, suggests the market expects higher future volatility, thus a higher implied volatility.
📊 Key Facts & Numbers
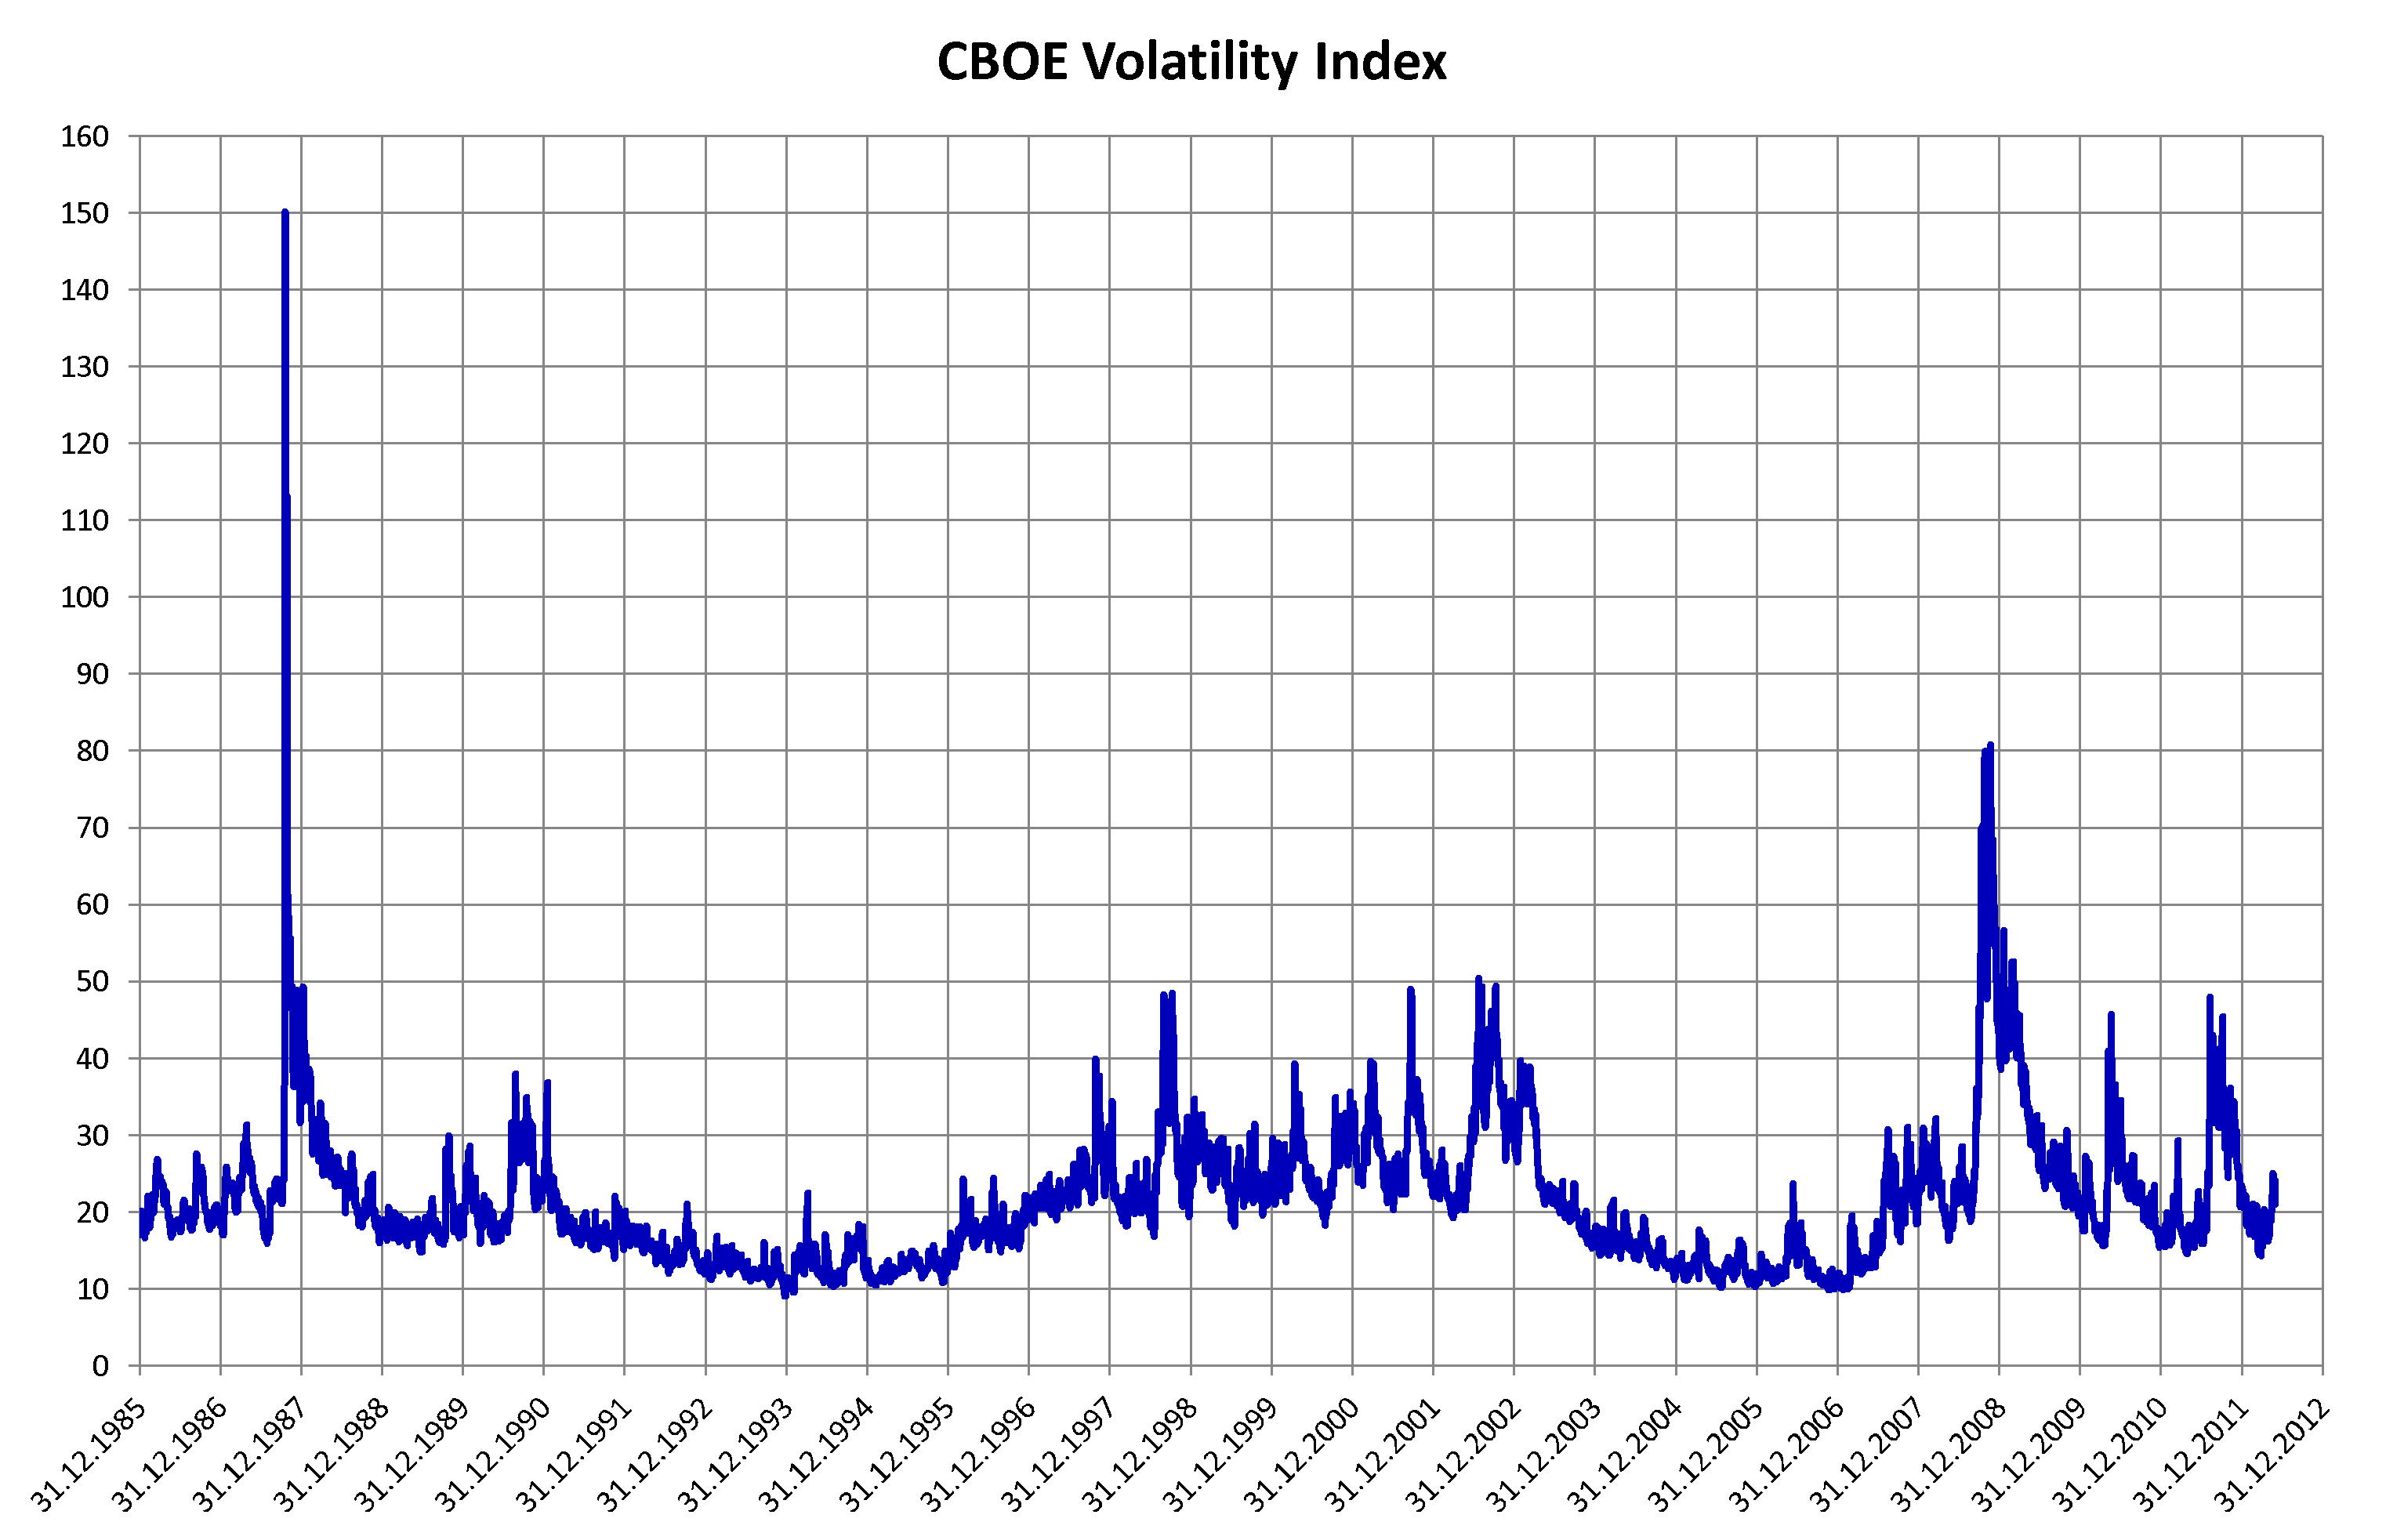
The VIX, often dubbed the 'fear index,' is a prominent measure of expected market volatility. For context, a VIX below 20 generally indicates a relatively calm market, while a VIX above 30 signals heightened investor anxiety and potential for significant price swings. The average annual volatility for the S&P 500 has historically hovered around 15-20%, though this figure can fluctuate significantly year-to-year. For example, 2020 saw annual volatility exceed 30% due to the COVID-19 pandemic.
👥 Key People & Organizations
Key figures in understanding market volatility include Louis Bachelier, whose early work on speculation provided a mathematical foundation. Fischer Black, Myron Scholes, along with Robert Merton, developed the Black-Scholes model, which revolutionized options pricing by incorporating volatility. The Chicago Board Options Exchange (CBOE) is instrumental in calculating and disseminating the VIX, making it a central player in volatility markets. Prominent hedge funds like Renaissance Technologies, known for its quantitative strategies, heavily rely on sophisticated models to navigate and profit from market volatility.
🌍 Cultural Impact & Influence
Market volatility profoundly shapes investor psychology and behavior, often driving decisions based on fear or greed. Periods of high volatility can lead to panic selling, while sustained low volatility might foster complacency and excessive risk-taking. The cultural perception of volatility is often negative, associated with uncertainty and potential loss, yet it also represents opportunity for skilled traders and investors. It fuels dramatic narratives in financial news, influencing public perception of economic stability and the perceived fairness of financial systems. The dramatic swings captured by the VIX have become a shorthand for market sentiment, permeating discussions from Wall Street boardrooms to casual conversations.
⚡ Current State & Latest Developments
Market volatility remains a central theme, influenced by persistent inflation concerns, geopolitical tensions like the war in Ukraine, and evolving central bank policies. The Federal Reserve's interest rate decisions continue to be a major driver, with markets reacting sharply to each announcement. While the VIX has generally trended lower from its pandemic peaks, it remains sensitive to economic data releases and global events, indicating an ongoing environment of watchful uncertainty. The rise of algorithmic trading and high-frequency trading also contributes to the speed and intensity of volatility, as automated systems react instantaneously to market news.
🤔 Controversies & Debates
A central debate revolves around whether market volatility is inherently 'bad' or simply a neutral indicator of price discovery. Critics argue that excessive volatility, particularly driven by speculative trading or algorithmic feedback loops, can detach asset prices from fundamental values, leading to systemic risk. Others contend that volatility is a necessary component of efficient markets, providing opportunities for arbitrage and reflecting genuine shifts in risk perception. The debate also extends to the role of central banks: should they intervene to smooth out extreme volatility, or allow markets to find their own equilibrium, even if it means sharp downturns? The effectiveness and desirability of quantitative easing and other monetary policies in managing volatility are also hotly contested.
🔮 Future Outlook & Predictions
The future of market volatility will likely be shaped by several converging trends. Increasing interconnectedness of global financial markets means that localized events can trigger widespread volatility more rapidly. The ongoing transition to a greener economy, with its associated policy shifts and technological disruptions, is expected to introduce new sources of volatility in energy and commodity markets. Furthermore, the increasing prevalence of AI in trading could either dampen volatility through more efficient price discovery or exacerbate it through unforeseen algorithmic interactions. Experts predict that while extreme spikes like those seen in 2008 or 2020 may not be constant, a structurally higher level of volatility might persist due to these complex, interconnected factors.
💡 Practical Applications
Volatility is not just an academic concept; it has direct practical applications. Investors use volatility measures to assess risk and construct diversified portfolios, often employing strategies like dollar-cost averaging to mitigate the impact of price swings. Traders utilize volatility for speculative purposes, betting on price movements or selling options to profit from the time decay of implied volatility. Financial institutions use volatility metrics for risk management, determining capital requirements and hedging strategies. For example, a bank might increase its hedging activities when implied volatility rises, anticipating larger potential losses or gains.
Key Facts
- Category
- vibes
- Type
- concept